Smooth Curves, Rough Edges: Using Simulators to Map the A.I. Future
What Emergent World Models Can Show us, and what they can hide from us.
In This Post:
A Giant ‘What If’ Machine
When I Assume, AI Makes an Ass Out of Me, You, Itself . . .
Seducing Me with Sexy UI
You Know Who Considers Humans a Bottleneck? Terminators. And Assholes.
Prying Open the Data
Gimme the Bad News. Just Not Too Much.
I've spent a good chunk of the last three years arguing with various folks about whether 'AI will do X' or 'AI won't do X.' It gets extremely frustrating because for the most part, the people I'm arguing with are smart, kind, and well-informed. We just have differences of opinion. It often feels like we’re all just wildly, desperately guessing about whether the robots are going to save us or doom us, and nobody really knows anything.
That's why I was super excited back in March when EPOCH AI released its The Growth and AI Transition Endogenous (GATE) model - a kind of 'world simulator' that's free, relatively easy to use and available to the public (and here is the accompanying paper).
A Giant ‘What If’ Machine
Imagine a giant, interactive "what-if machine" that lets you dial in your preferred assumptions about the future of computer chips, research spending and workplace automation, then presses "play" to show you a movie of how the world economy unfolds in the decades ahead.
In practice you move a handful of sliders like ‘how cheaply do chips improve?’ or ‘How much cash pours into data-centers and new algorithms?’ or ‘How easily can people switch jobs?’ and the simulator returns a year-by-year story about jobs, wages, investment and overall growth.
My first thought was 'Great, now I can use this to prove my opponents wrong', which would be great. My second thought was 'Oh wow, now they can use this to prove me wrong' which would actually be better. As it turns out, it's neither, really.
This thing is like a flight simulator for the apocalypse, or the utopia, depending on how you set the dials. You can fiddle with sliders that control how fast computer chips get better (spoiler: very fast), how much money people pour into building robot brains (spoiler: all of it), and how easily humans can retrain for new jobs (spoiler: not very easily, have you met humans?).
And then—this is the beautiful/horrible part—it spits out a year-by-year economic forecast showing what happens to jobs, wages, and the global economy. You should give it a try, here.
It turns a conversation that often relies on slogans like "AI won't replace jobs, just tasks" or "AI won't take your job, someone using AI will take your job" into a set of concrete, testable scenarios.
When I Assume, AI Makes an Ass Out of Me, You, Itself . . .
I tried to write something on GATE a few months back, but my thoughts didn't really gel until I finished my post "AI as a Global Rorschach Test" In a way, GATE is the operationalization of the Rorschach test. You can, and indeed must, put in your own assumptions about the future, and the model tells you how your own particular assumptions result in a particular version of the future.
OK, but that's what a forecast model is supposed to do. A forecast model is supposed to allow you to pressure test your own assumptions, and compare them against others, to see what makes sense.
After playing around with it for a while, I became more concerned about the assumptions that it wasn't showing, and the assumptions it wasn't allowing me to test.
In fairness, the authors of GATE make a pretty plain and declarative statement about what their modeling excludes:
Robots with arms and sensors, which are essential for many physical jobs, like flipping burgers, are treated as if they cost nothing beyond the software that guides them.
GATE assumes competitive pricing rather than market power, even though A handful of companies dominate the real-world chip market.
Political backlash
new kinds of work that arise when old ones disappear.
None of these are modeled in depth.
Seducing Me with Sexy UI
All of those didn't concern me as much as those elements that were clearly part of the equation, but then didn't somehow show up in all the slick graphs and charts. When you first open the GATE playground it looks disarmingly comprehensive - there are cool sliders for chip progress, R & D spending, even a toggle for "labor-reallocation frictions." Any movement of the sliders refreshes the model, which outputs 20 pre-baked, very well done graphs showing the outputs of any simulation run. The more you play with it, the more you see how most scenarios (however you align the sliders) point towards an insanely bountiful future – we're talking double digit Global GDP growth annually! In fact, most of these graphs point up! up! up!, at least in all the simulations I ran.
But what's striking is what you don't see. There's no line for how many flesh-and-blood people are still working, no index showing whether real wages are rising or falling, and no gauge - however rough - of how the gains are split. Explosive growth becomes more or less attractive, depending on who is capturing it. And I think even the layman can see the emergent possibility that all of the gains brought by AI might be captured by a handful of tech companies and their shareholders.
And I was troubled by the fact that every curve on the screen is a macro curve: global GDP, marginal productivity for all human workers, etc. GATE models the whole world, and in doing so, washes out any differential effects the AI revolution might have.
Those omissions aren't just cosmetic; they steer interpretation. Under the hood GATE assumes the economist's idea of a "representative household" that supplies all of its labor every year. Because no one can quit or be laid off inside that math, the model never produces a headline unemployment number to graph.
But it kinda does. If you can read between the lines and squint your eyes a bit, you start to see worrying trends emerge.
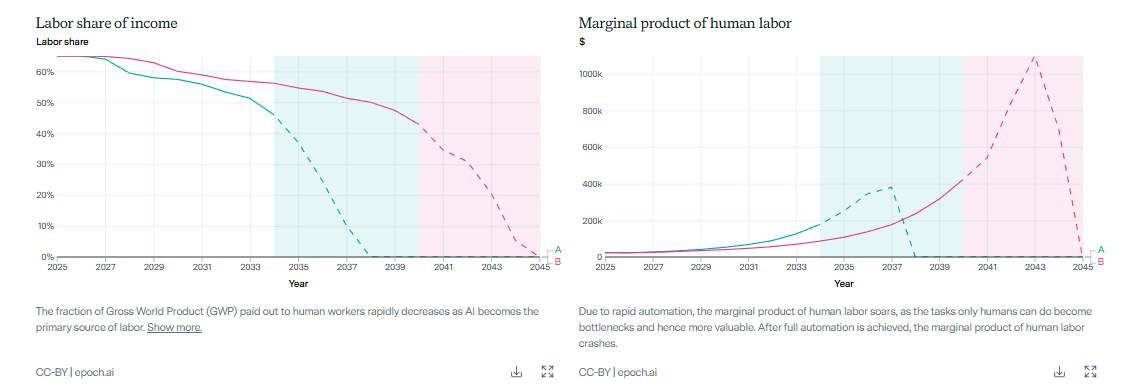
Consider this screen capture from GATE's default dashboard:
The graph on the right shows an explosion in the "Marginal Product of Human Labor." In conventional economic terms, this means the added value that a company gets from deploying one additional unit of labor (e.g. adding one worker). The story it tells is that human labor is going to become very, very valuable. If you get paid 100k/year to do a thing today, you might get paid 1M/year to do the thing in 2045.
But the graph on the left shows an equally steep decline in the "Labor Share of Income" – the amount of global income being paid out to human workers.
Put the two graphs together, and they paint the whole picture: in the future, very few humans will be employed, but those humans that are employed will be very, very well compensated, because they will be doing the things that machines never figured out how to do. Everyone else, presumably, will be unemployed. The dashboard never states that – but that math screams it.
These design choices have real narrative power. Policy makers, investors, and journalists tend to quote whatever fits on a single slide. When the ready-made chart pack shows only explosive GDP and hockey-stick productivity, it frames the debate as 'how much and how fast should we invest in AI' rather than a balancing act between growth and the distribution of prosperity.
You Know Who Considers Humans a Bottleneck? Terminators. And Assholes.
Another narrative choice bothered me even more so: the authors' discussions on 'Bottlenecks' - which they define as anything that could dampen the effects of AI automation on economic growth. Merriam-Webster defines 'bottleneck' as
“Someone or something that slows or halts free movement and progress.”
The authors' framing suggests that it is the progress of AI, and economic growth, that requires free movement and progress, and therefore things like 'investor uncertainty' and 'Labor reallocation' should be treated as ‘frictions.’ The word 'bottleneck' doesn't have a precisely negative definition - but it certainly has a negative connotation, and it’s used to strong effect here. 'Investor Uncertainty' - the unwillingness of folks to pour trillions of dollars into a radically new technology - is an impediment to the glorious future that lies in waiting. As is 'Labor allocation' - people's ability and/or willingness to be trained into new forms of work. That’s like calling hurricane evacuations "traffic bottlenecks." Technically accurate, but missing the point that maybe the people fleeing for their lives have legitimate reasons for not driving faster.
Call me a hippie, but I think that human flourishing ought to be the ultimate objective, and everything that might get in the way of that ought to be stamped with the labels 'friction' or 'bottleneck.'
Prying Open the Data
So how do we answer the real questions - Will I have a job? Will my paycheck keep up with prices? Will the gains pool in a few balance sheets? You take the model and crack it open.
My intuition was that the data was already there, hiding just out of view, like in the example above. If the model was sophisticated enough to map global economics, climate trends, and technological advances, it likely could be made to output the kind of metrics that I was more concerned about. I ended up extracting a parallel set of data from a related model by the same organization, EPOCH AI. Their “Fast Takeoff Model” used much of the same data and performed similarly as well. It had the advantage of having an open GitHub repo, where the data and the model structure could be freely downloaded and replicated.
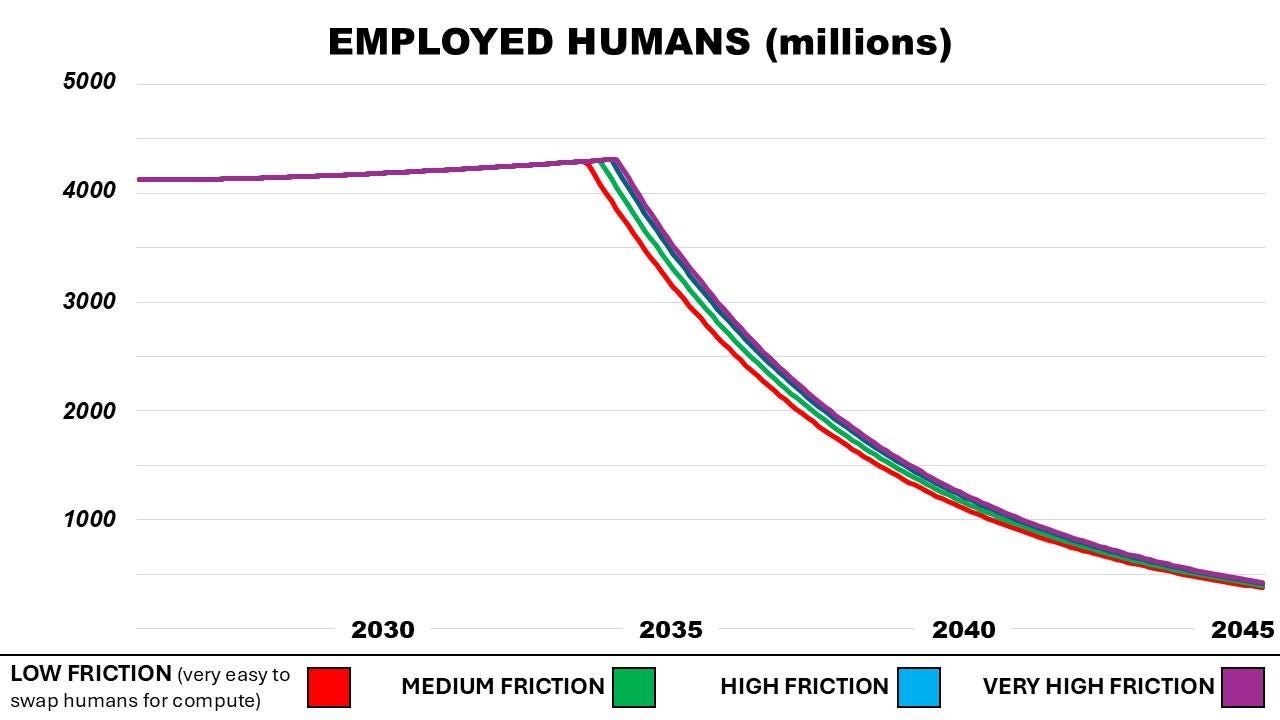
Using that data, I was able to reconstruct the model to output some of those metrics that I thought might be missing. Because a model, by its nature, can represent an infinite number of possibilities, I restricted this part of the investigation to a single slider: labor-reallocation frictions. How easily can human workers segue to new forms of work, as AI automates their old jobs. One of the most frustrating parts of the GATE model was that labor friction toggle was turned off by default – meaning that as workers lose their jobs to automation, they instantly find newer, better jobs with no interruption, and no additional training. This seems farcical. Both models allow the user to adjust labor friction to any specification, and for this part, I used four levels: low (meaning it’s very easy for humans to adapt to new roles), medium, high, and extra high.
Running the FTM model, on my own machine, to produce my own custom graphs, I confirmed what I had been afraid of:
The first graph shows an increasing capture of all wealth by AI. Which seems like a no-brainer. If AI takes over 50% of the work, it will capture the value created by that labor. Practically, this means that AI companies, and their shareholders, take over that wealth. So, the graph can be read as ‘.001% of the human population capture 100% of human wealth, eventually.’
The second graph shows a plummeting of human wages. WTF? Both the GATE and the FTM models told us that the value of human labor would explode! And people would get paid $1M a year! Yes, that may be true, for a very, very small number of people. But overall, the value of human labor disappears, because machines can ultimately do their roles faster, and less expensively.
Finally, the third graph shows something which should have been obvious all along: as machines take over human roles, there’s less and less for humans to do. The original GATE and FTM models didn’t show this, because they didn’t have any sort of floor on the reward for human work. Within the logics of GATE and FTM, the reward for human work (e.g. a paycheck) could drop to nearly zero, and the labor required for a human role (how many hours you work during a day) could also drop to nearly zero, and yet that human would still have a ‘job.’ I corrected that. So, predictably, humans drop out of the labor force rapidly as their skills are either not needed, or uncompensated.
Gimme the Bad News. Just Not Too Much.
Should you panic? No . . . as I mentioned. . . the scenarios described above are 4 scenarios out of, quite literally, an infinite number of scenarios. They represent a particular assembly of settings and input levels that I specified. Perhaps in that sense they betray my own biases. But hey, at least I can admit mine!
These models seem, by comparison, pretty opaque about their own. By surfacing only the macro wins and burying the human-level outcomes two clicks and a code snippet away, the interfaces themselves become optimism filters, like a GPS that tells you how fast you’re driving but never tells you if you’re heading towards a cliff.
It’s also a good reminder that the psychologist administering the Rorschach is a person, too, with their own set of hangups and biases. The tools designed to extract, decode, and measure our assumptions about the future were built by people, with their own assumptions about the future. I think ultimately, GATE - and tools like it - should be a valuable part of the AI discourse. But if we want a fuller public conversation about AI's upside and its risks, the first step will always be just flipping those hidden assumptions into plain view.


